Report Builder


|
Report Builder |
|
|
The easiest way to learn how to use the Report Builder is to run through a few examples. Example 1: Print a list of all patients aged 65 and over To do this select Open > Patients and search for all patients aged 65 and over. For information on how to do this please refer to the Queries and Searches Chapter.
Click on the Print button at the top of the Patients List.
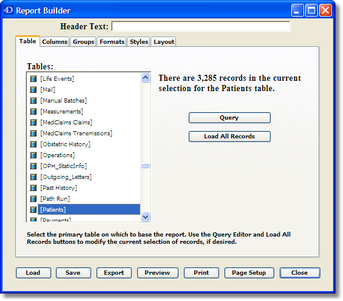
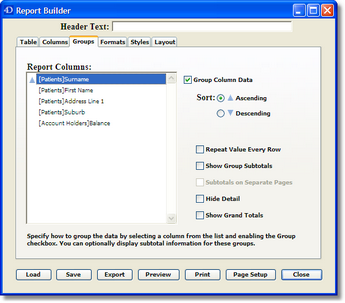
The Report Builder window will open as shown below:
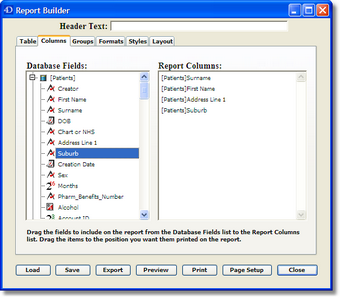
The Tables Window This window displays a list of all Tables in the database. All you need to do is select the table for the report. On the right of this window, you have the option of searching the Patients Table again or of selecting ALL records in the table. The Columns Window This window allows you to select the columns to be included in the report.
To add a column, double-click on the field in the list on the left and it will be transferred to the list on the right. Alternatively, you can drag and drop a field from left to right.
To remove a field from the Report Columns list, drag and drop it from right to left.
To change the order of the columns, drag and drop the fields within the list on the right.
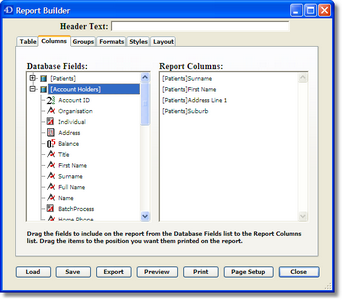
Because the Patients Table is related (linked) to the Account Holders Table, we can also include fields from the Account Holders Table.
To do this, click on the triangle or plus (+) sign next to [Patients] to hide the fields from the Patients Table and then click on the triangle/plus next to [Account Holders] to display the fields in the Account Holders Table so that the window now looks like this:
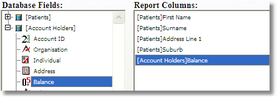
Add the Account Holder's balance field to the Report Columns list:
The Groups Window Grouping is similar to sorting.
To have a report sorted by the values in a column, select the column on the left then tick the Group Column Data checkbox.
To sort the records alphabetically by Surname click on the Surname field on the left and then click the Group Column Data checkbox.
Note: You can sort in either Ascending order (usual) or Descending order.
The Repeat Value Every Row checkbox ensures that the value for every record is printed. ie. instead of: it will print as:
The Show Group Subtotals checkbox would add the number (count) of each particular value to the report. i.e. it would tell you that there were 30 Smith's, 4 Smithey's and 1 Smitherton etc.
The Subtotals on Separate Pages creates a new page for each new value in the selected column.
The Hide Detail checkbox hides the details of the report. i.e Smith 30 Smithey 4 Smitherton 1
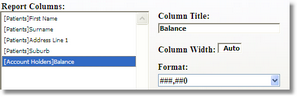
The Show Grand Totals checkbox displays the grand total for the selected columns at the bottom of the report. The Formats Window This window allows you to change the title of the column, as well as specifying formats for date and number columns.
The Column Title allows you to override the field name in the database to a column title more appropriate.
The Column Width allows you to specify the width of the column as it will appear on the report. The measurement is in Points. This varies between platforms and computer Display settings but as a rough guide Macintosh has approximately 30 Points to a centimetre and Windows has approximately 40 points.
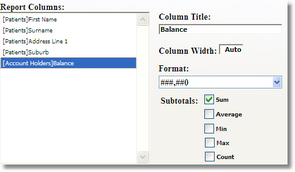
The Format tab allows you to format date and number fields by selecting the required format from the drop down menu.
Subtotals allows you to display numerical columns accordingly (e.g. by sum, average, etc)
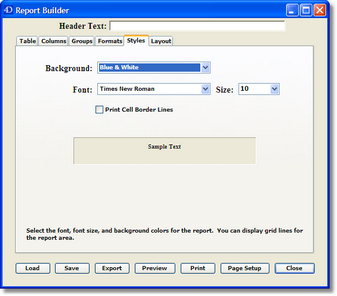
The Styles Window This window allows you to customise the appearance of the report including font and font size, background colours and banding, and whether or not each particular field will be surrounded by a border (like an Excel spreadsheet).
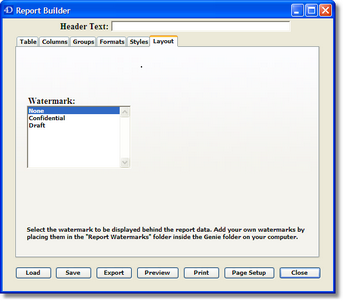
The Layout Window In this window you can assign a watermark. You can add your own watermarks by placing a picture file inside the "Report Watermarks" folder in the Genie folder.
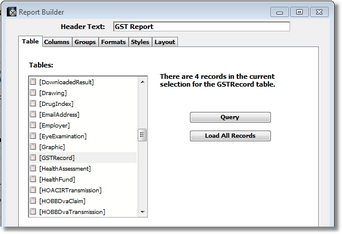
Example 2: Creating a GST Report The GST Report in Maintenance and Reports also uses a QuickReport. When you click on the GST Report button, the Report Builder will open to the following window, with the GST Records table already selected.
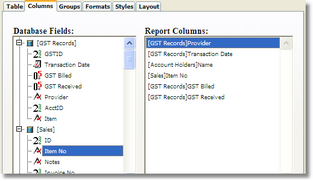
Click the Columns tab and select the fields as shown.
Note: You have access to both the [GST Records] and the [Sales] tables.
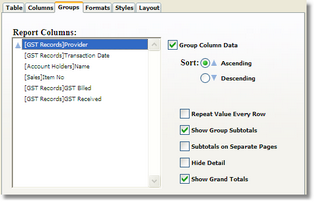
Click on the Groups tab and set it up to look like this.
Note: The Provider column is grouped so that the report will split the GST between providers.
Selecting the Show Group Subtotals and Show Grand Totals will subtotal each Provider's GST and give a Grand Total at the end of the report.
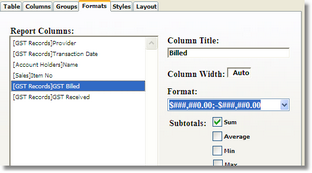
Click the Formats tab and set up like this
Note: If you do not select Sum for GST Billed and GST Received then these subtotals will not show up on the report.
Give your report a name and Save it so that when you next go to print a GST Report through Maintenance and Reports all you will need to do is Print it! Example 3: Printing a List of your Private Fees Select Open > Billing Items and search (Records > Search) for all items where Private Fee field is 'not equal to zero'.
Click on the Print button to open the Report Builder and create a report like the following.
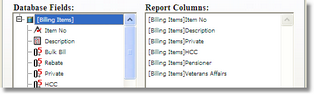
The Columns Window
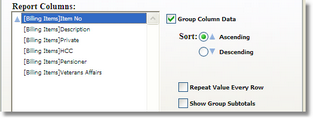
The Groups Window
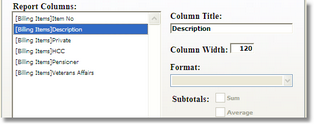
The Formats Window
Because the Description field contains a lot of text, we want to limit its width to about 120 points or so.
You can now print your private fees! |